Turbo-Chart can be used to prepare Gantt charts for any project schedule with simple and creative use of the coding used to produce Time Location / Linear Schedules.
This article outlines the method to produce Gantt charts using Turbo-Chart to represent any task from schedules prepared in Primavera P6 . The same method is also applicable to schedules prepared in MS Project, Asta Powerproject, Safran Planner/Risk or in fact, any spreadsheet ready data.

Step 1 – Data Preparation
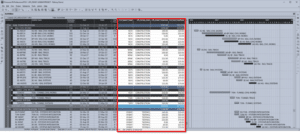
Ensure your schedule can include the additional data required by Turbo-Chart
- ShapeCode – a text field that is used to define how tasks will be displayed on the Gantt chart
- Location Start – a numeric field used to position the start of a task on the location axis
- Location End – a numeric field used to position the end of a task on the location axis
Step 2 – Task ShapeCodes
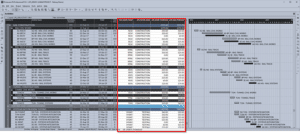
ShapeCodes in Turbo-Chart are used to define the display properties for tasks, the shape, the color, the style of the pattern etc. Apply the same ShapeCode value to tasks that will have common display properties and, only apply ShapeCodes to the tasks to be displayed on the Gantt chart (Turbo-Chart can ignore tasks with no ShapeCode)
In the image below, ShapeCodes have been applied such that similar tasks will be shown with the same display properties in Turbo-Chart

Step 3 – Defining Locations
Unlike linear projects, where the position of works along the linear alignment are used, to produce Gantt charts, the location values define
- Where a task is positioned, and
- The thickness, i.e.. the width of a task
By rotating the axes in Turbo-Chart, such that the Time axis is horizontal, and Location axis is vertical, the start of an activity defines where it is positioned, and the end defines the width.

By positioning similar tasks into “Swimlanes” it is possible to show multiple tasks in sequence on the Gantt Chart, or if required overlapping (Applying transparency values to the ShapeCode may assist in this case)

Step 4 – Import into Turbo-Chart
Follow the method to import into Turbo-Chart and define the display properties for each ShapeCode. Adjust the location and time axes as required, and if required, use Highlighters to emphasis selected dates, periods, values on the location axes, or entire bands of locations. Annotations can be added to the chart as usual also.
Step 5 – Making the Gantt chart meaningful!
Once the Gantt chart is set up in Turbo-Chart, updates from the source schedule can be easily synchronized – so that the Gantt chart is always reflecting the latest schedule dates, but the other standard features of Turbo-Chart can equally be applied to Gantt charts as used for Time Location /Linear Schedules:
- Import multiple versions of the schedule as datasets
- Compare datasets, ideal to demonstrate baseline vs forecast schedules
- Display critical paths, even how critical paths have changed between schedule datasets
Our video below provides a quick overview of how this all works using Turbo-Chart
Further Help
Should you need further help regarding Turbo-Chart, we are here to support you!
Just send an email to support@pmerasupport.com


