Turbo-Chart v1.2 Features
Over the last weekend, Turbo-Chart v1.2 was released and includes a series of new features and improvements that are described below. Our Change Log lists all new features, improvements, and fixes as each version of Turbo-Chart is released.
Legend Scale and Text Size
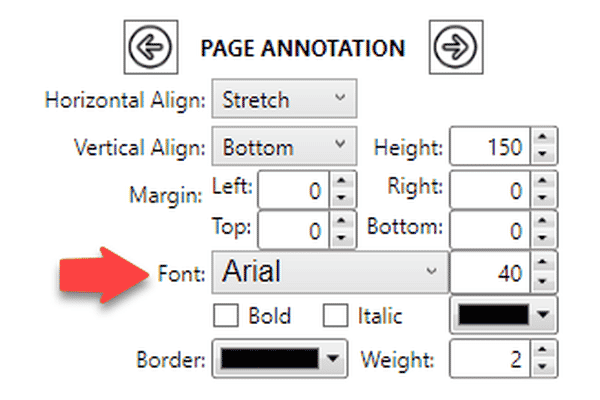
The size and style of font used in in chart legends can no w be set in the page layouts. To set select File>Page Layout, click on the legend cell, and set the required font style and size
The legend will now also be scaled to always fit within the size of the legend cell provided.
More details on setting page layouts are available on our Print Layouts post, or in our User Guide
Data Paste from Clipboard
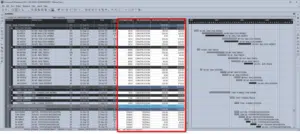
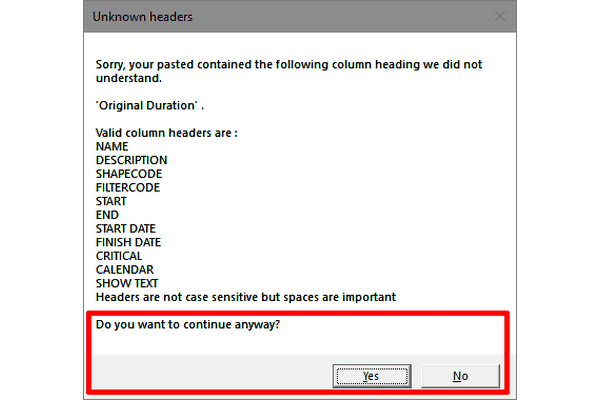
When pasting schedule data from the clipboard into a dataset (a feature useful for copying data from layouts or spreadsheets), any data columns that do not match Turbo-Chart fields are now ignored and the valid data can still be imported.
More information on using the paste from clipboard option for P6 is posted in our P6 Layouts and Spreadsheet Import [PA4] article.
Legend Sort Order
Setting the legend sort order has now been improved. Select the Shape legend item to re-order, then use the arrow keys to position the legend in the legend order. Legend orders can also be manually entered in the Data>Shape Library window.
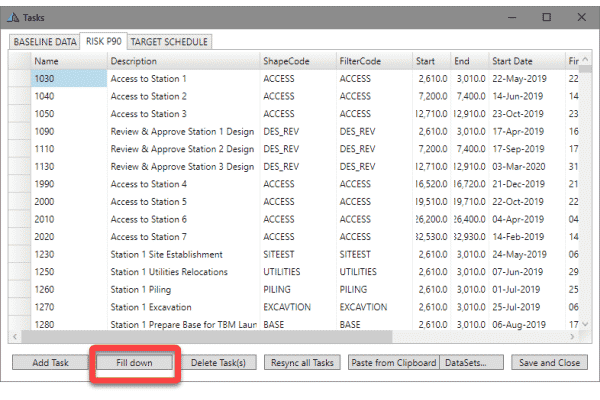
Fill down in Data grids
If manually adding data into the Tasks, Shape Library or Highlighters windows, there is now a Fill Down option available. When used with the filters in column headers, data can now be rapidly modified.
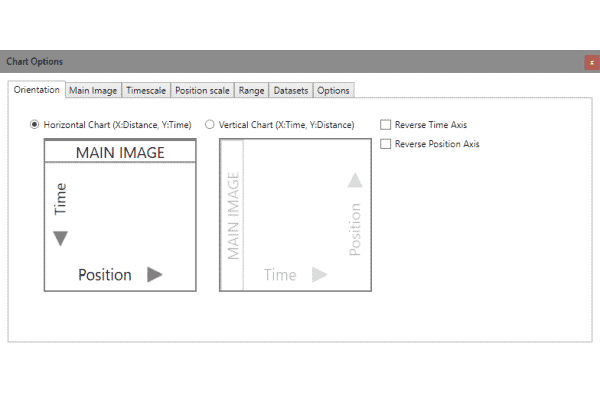
Tabbed Chart Options
The chart options dialog has been enhanced an put into tabs allowing easy access to the options required.
The Chart orientation now provides an explanatory note on the position of key chart elements
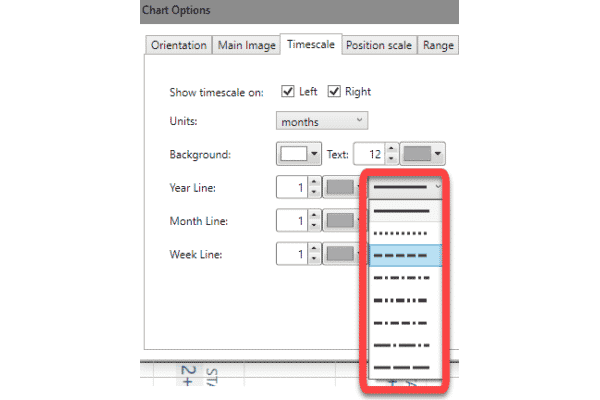
Time Grid Line Types
In addition to setting the line thickness and color for time grid lines (Year/Month/Week), the line type, such as solid or dashed, may now also be set for these grid lines.
Dataset Opacity/Blending Sliders
When displaying multiple datasets on a chart, setting the level of transparency and the blending (to a chosen color) can now be entered in as a direct percentage value
Hide Tasks & Calendars
Turbo-Chart now includes an option to hide all tasks and calendars displayed on a chart. This is useful when checking the annotations or highlights being displayed on a chart.
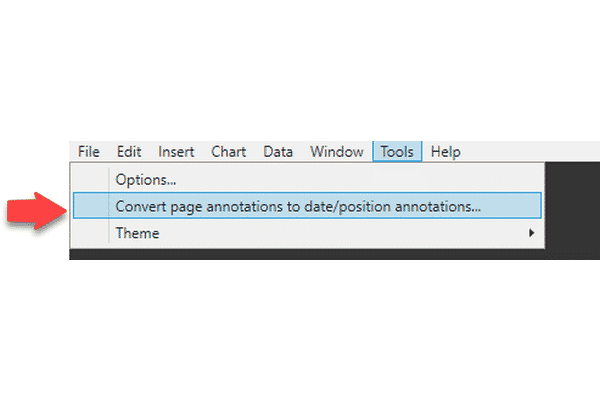
Convert Page Annotations
Chart annotations such as text and images may be set relative to
- The Page
- Date and Location
- a selected Task
When set relative to a page, any changes to the page size may shift the annotation away from its intended position. By now selecting Tools>Convert Page Annotations… these are now automatically converted to “date and location” relative annotations and set to their current position