SOFTWARE APPLICATIONS
Software applications for the preparation of Linear Schedules can be broadly categorized into three categories:
- Basic drawing applications
- Linear Scheduling software applications
- Linear Schedule visualization applications
BASIC DRAWING APPLICATIONS
Manually drawing linear schedules is an option, and many free or cheap drawing applications are available that can achieve this. Even familiar applications with graphing or charting applications could be used. However, there are many issues with this approach – it is time consuming, error prone, difficult to update and not a scalable solution that can be easily adopted across multiple projects or applied to increasingly complex projects. In developing Turbo Chart we considered the issues of the basic drawing methods and wanted to ensure they wouldn’t exist.
Time Consuming
We believe Turbo Chart is quick and easy to use. Creating a linear schedule for the first time is measured in hours, not days and updating the Linear Schedule following a project schedule update is completed in minutes if not seconds. Our philosophy is that preparing Linear Schedules should not consume time that can be better spent improving the project schedule and the project outcomes themselves.
Error Prone
Turbo Chart does not rely on any human translation of dates. By being able to directly link and import from project schedule data errors are minimized.
Difficult to Update
We understand that project schedules are never static, schedules are constantly changing and given the benefits that linear schedules offer, they should also be updated to reflect the most up to update project schedule. So we designed Turbo Chart to be as easy as pressing “Synchronize” to refresh data from the project schedule itself.
Non-scalable Solution
Preparing Linear Schedules for projects should not require starting from scratch each time. Once a Linear Schedule has been prepared using Turbo Chart, the process for creating additional Linear Schedules, or for the next project is exactly the same. In fact, Turbo Chart has modular elements that be adapted across many projects.

LINEAR SCHEDULING SOFTWARE APPLICATIONS
While we are not aware of any true linear scheduling method software available commercially (yet), there are project scheduling tools that are capable of traditional CPM scheduling, presented in linear scheduling format, or variants such as Line of Balance Software, Line of Balance Chart, Location Based Scheduling, Time Chainage Software, Time Location Distance Diagram Chart and such.
Software capable of such Linear Schedule Methods can be very expensive, especially if the features provided are doubling up on features that exist in other scheduling software already being used. Even when offered trials or free downloads of these Linear Scheduling Software, the trial period offered will not be sufficient to understand the complexities of the tools and the methods they employ, often requiring extensive training and on-the-job learning.
TILOS LINEAR PROJECT SCHEDULING SOFTWARE
Tilos Charts
We are often asked if Turbo Chart is similar to Tilos, a tool now owned by Trimble. Tilos has positioned itself in the market as the leading tool for linear projects. In fact, many practitioners in the industry were not aware that options other than Tilos exist for generating Linear Schedules, to the extent that Linear Schedules are sometimes referred to as “Tilos Charts” or “Tilos Schedule”
Specialized Application
Tilos is a specialized application for linear projects, designed to be used as scheduling software, capable of developing a CPM project schedule that uses Linear Schedules to create and link schedule tasks to develop critical paths, resource analysis etc.
Read More > Tilos Training
CPM schedule data
While developing Turbo Chart, we had never considered comparisons to Tilos as we never intended to develop the scheduling capabilities within Turbo Chart, however, as we continue to promote Turbo Chart we are discovering that in practice, the most common use for Tilos is to convert existing CPM schedule data and represent that information in a Linear Schedule/Time Location format, and not using the more complex features of Linear Project Scheduling.
LINEAR SCHEDULING VISUALISATION APPLICATIONS
Between basic drawing/graphical applications and the more sophisticated Linear Scheduling systems, there is the ability to capitalize on the data already contained within scheduling tools, and to provide the Linear Schedule output based on this data. As well as the graphical output, there are other key features that make such applications preferable to other options:
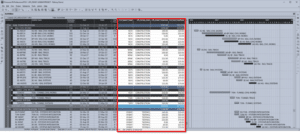
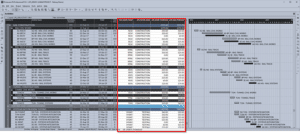
Turbo Chart is a visualization tool that has been designed to assist linear project planning and scheduling by creating Linear Schedules easily and quickly from existing schedule data. All that’s needed is:
- Additional data for tasks
- Linear start and end locations
- Code used to format the tasks display on the Linear Schedule
Connection to schedule data sources
Turbo Chart can connect directly to schedule data sources, allowing Linear Schedules to be updated in seconds as the project schedule is updated. Turbo Chart’s dataset feature can display multiple sources of data together on a single Linear Schedule, to show performance comparisons such as actual vs planned. Or Perhaps to display summary schedules overlayed against detailed schedules. Turbo Chart can also be used to display consolidated schedule data from various sources, for example from multiple contractors using different scheduling tools.
Shape library and display options
By simply clicking on any task on the Linear Schedule, shape codes can define the display options for matching tasks, such as the task shape to display, the line type and fill color. The Shape libraries can then be saved and imported between Turbo Chart files or exchanged with other Turbo Chart users to have common presentation of Linear Schedules across your organizations projects. Turbo Chart can create multiple Linear Schedules, so any Linear Schedule can display a filtered set of shapes for a specified date and location range, from any selected datasets.
Custom time and location grids
Turbo Chart’s highlighters lets Linear Schedules use custom time and location grids to highlight key project features and dates, these can also be generated in a spreadsheet or exchanged between Turbo Chart files and users. Linear Schedules can even include text and images by simply copying and pasting into Turbo Chart, these annotations can be fixed to their position on the Linear Schedule, fixed by date and time, or fixed relative to the position of a task.
Data connectivity
The application should be able to connect to scheduling data quickly and easily, and be able to update or synchronize as schedule data is updated. Ideally, a user could work on the project schedule and then update the linear schedule instantly with the changes made
Linear schedule configuration
The application should allow uses to configure the linear schedule as required for the project being presented. This includes features such as:
- Customizable axes for both dates and locations
- A date/location grid, and settings to configure how this grid presented
- Filtering and Display of schedule tasks
- Ability to add graphics and text to improve readability of the linear schedule
- Multiple Linear Schedules for varying presentations

LINEAR PROGRAMMING SCHEDULING SOFTWARE
Linear Programming as defined by Wikipedia as “ (LP, also called linear optimization) is a method to achieve the best outcome (such as maximum profit or lowest cost) in a mathematical model whose requirements are represented by linear relationships. Linear programming is a special case of mathematical programming (also known as mathematical optimization).” When used in the context of project planning and scheduling, the term program and programming may be used interchangeably with schedule and scheduling. The different use of these terms appears to be mostly related to geographic differences, where practitioners more influenced by UK standards use the term Program/Program vs those of US influence using Schedule. As such, Linear Programming Scheduling Software, when used in a project planning and scheduling context, is the same as referring to Linear Scheduling Software.
TIME CHAINAGE DIAGRAM SOFTWARE
Linear Scheduling methods are not a modern phenomena made available by sophisticated software tools. The benefits of using this visual representation of project schedules was well known before software tools existed to do such. Visitors to the Empire State building in New York can see an early example of how linear schedules were manually drawn by hand to manage the steel erection of the high-rise building in 1930.

Further Help
Should you need further help regarding Turbo-Chart, we are here to support you!
Just send an email to support@pmerasupport.com


