About the Project
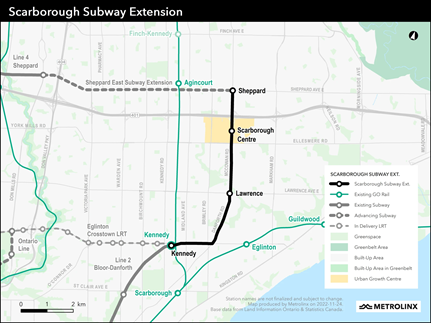
The Scarborough Subway Extension will bring TTC’s Line 2 subway service nearly eight kilometres farther into Scarborough.
It will extend from Kennedy Station to Sheppard Avenue and McCowan Road, providing quick and seamless transit for those heading into and out of the downtown core and those travelling within Scarborough. The extension will replace Line 3 (the Scarborough RT), helping to reduce travel times and improve access to jobs, schools and other key destinations throughout the city.
Project Highlights
Number of stations: 3
Connections to other transit options: ≤ 6
Route length: 7.8 km
PM ERA’s Assignment
Client: Metrolinx
Assignment:
Analyze, design, implement and handover dashboards for
Permit management
Property acquisition
Submittal management
Agreements
Schedule and earned value management
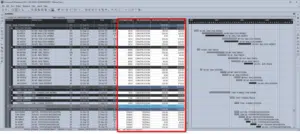
Tools used: Primavera P6, Excel, Power BI
The dashboards designed and built by PM ERA were all tailor-made to suit different levels, from operators to executives.
These dashboards collected data from various sources and integrated data of this project with other projects at the subways program level. The data were then transformed and analyzed in the dashboards to visualize the Key Performance Indicators (KPIs) that were developed in conjunction with the subject matter experts in Metrolinx. The KPIs facilitated smooth project delivery and pinpointed the bottlenecks and the areas for improvement.
Dashboard users could easily get to the info using a safe link sent to their work Microsoft account. They could access data from any device t using a web browser, viewingonly see info based on their individual access level.
The dashboards had slicers that allowed users to drill down to the specific information they wanted with just a few clicks.
Metrolinx has benefited from the dashboards by saving on resources required for the manual generation of regular reports.
Permit Dashboard
PM ERA studied the PLA process through various techniques such as interviews, document reviews, research, etc. and introduced a harmonized tracking system that was implemented throughout the agreements with different parties, from the technical advisors to subcontractors. Regular data updates collected from approximately 28 parties through the so-called tracking system were then analyzed, consolidated and integrated with other project-related data into the Permit Dashboard.
The provision of the Building Transit Faster Act (BTFA) was foreseen in the permit dashboard – in case an escalation was needed for the issuance of any permit.
By analyzing the previous records of various permit types, the dashboard provided a basis for future agreements with the authorities having jurisdiction.
Property Dashboard
PM ERA supported the enhancement of Metrolnix’s property acquisition management databases and integration of the data from the pre-acquisition and acquisition phases. The Property dashboard collected, integrated, and analyzed the data from huge databases that recorded every revision of different acquisition types throughout the entire process’s life cycle.
Submittal Management Dashboard
The submittals dashboard allowed users to effectively track the status of document submissions to various parties.
Agreement Dashboard
The agreement dashboard provided a visual representation of the status of Metrolinx agreements with external organizations. This allowed users to readily identify agreements that carried higher risks for Metrolinx projects due to potential delays occurring at any stage, spanning from negotiations through execution to completion.
Schedule Dashboard
The schedule dashboard let users view the Gantt chart and access specific project schedule details they were permitted to see, without requiring a license for scheduling software. The dashboard also examined cost and resource data, presenting visualized information on earned value analysis.Dashboard users were able to track the trends of changes to important project milestones and compare up to three schedules (e.g. current vs previous month vs baseline).
Added Value
– Saving resources and time in generating regular reports
– Integrated data from different data sources into a user-friendly dashboard
– Enhanced accessibility to information
– Enhanced security of information (secured online report vs pdf files/paper reports)
– Red flags and highlighted bottlenecks