Turbo-Chart v1.3 Features
The latest release of Turbo-Chart features many updates from our last major v1.2 release , that are listed on our change log . The main feature of v1.3 are customer requests for additional Shapes available to represent schedule tasks in Turbo-Chart.

Task Shape Selector
The task shape selector now features a tabbed selection of shapes and their respective display properties
Triangle Shapes
Turbo-Chart customers have requested the ability to represent schedule tasks as triangle shapes on the Time Location charts. V1.3 now features two separate shapes for this:
- Triangle Increasing, and
- Triangle Decreasing
Each of these shapes is used to represent linear works that occupy or make available space as they progress along the linear alignment
Triangle Shape Example Usage

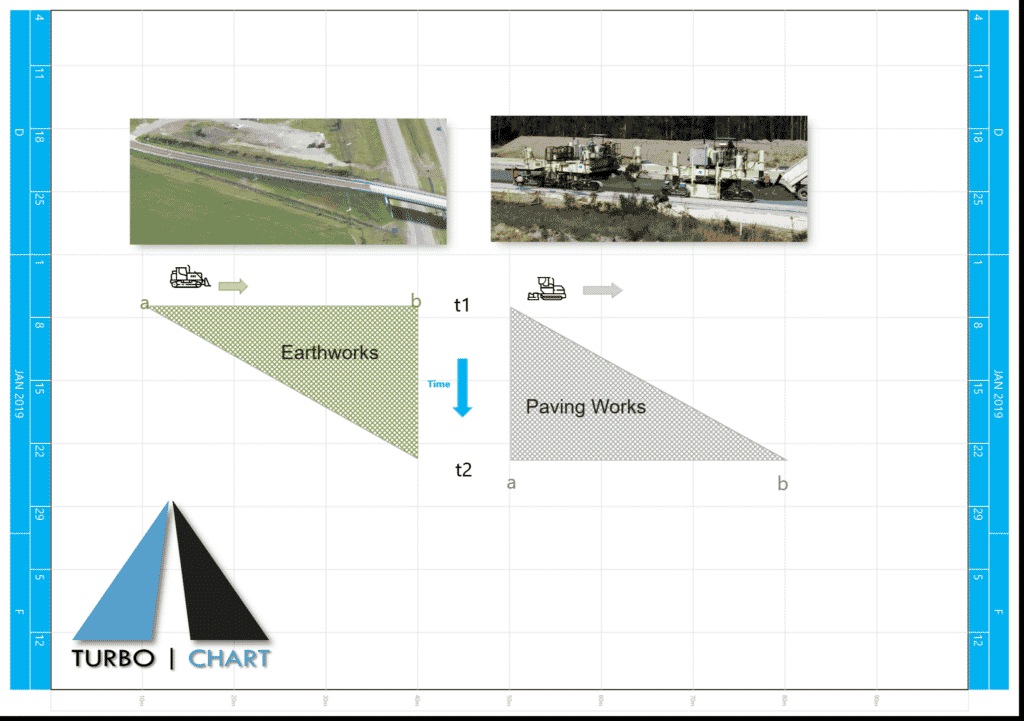
Example 1: Triangle Decreasing for Earthworks
In this example, consider the earthworks associated with a bridge embankment. The embankment construction proceeds from the lower end (a) to the higher end (b) as time progresses from t1 to t2. The triangle represents the time and area over which the earthworks will be occurring, meaning other works will interfere if they are planned in the same area/time. The area at the lower end is available the earliest as the work moves towards the higher end (b)
Example 2: Triangle Increasing for Paving Operations
In this example, consider paving operations on a highway. The paving proceeds from (a) to (b) as time progresses from t1 to t2. As the paver progresses, the area behind the paver (where the pavement has just been laid) is unavailable for a period of time for curing etc. This example could also be used in cases where a works train or a TBM may occupy space behind the “head” of the operations
In both examples the triangle shape can be flipped horizontally by swapping the values in the Start and End Position representing the direction that the linear works are planned to occur.
Triangle Shape Example | Download
Download (Zip file) sample Turbo-Chart file to see the above features


