Pourya Amiri
Introduction
The widely used Gantt charts are great tools for scheduling and managing conventional projects; however, those who have worked with the Gantt charts know that identifying scheduling flaws and clashing activities is quite a tedious job.
This paper will demonstrate an easy and efficient method to identify your schedule issues for linear projects.
Linear projects are those projects where works occur continuously or repeatedly over a linear alignment and can also interact with the activities happening at fixed locations along the alignment.
Typical examples of Linear projects are Tunneling, Highways, Railways, Pipelines, etc.
This concept can also be applied to vertical high-rise building projects.
Activity Clash
Based on the size and productivity rates of the projects, managing the schedules’ logic would be very critical to utilize the resources efficiently and effectively to avoid lengthy delays and clashes between the subsequent activities.
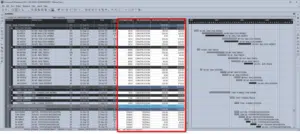
For instance, in a road construction project, rolling the binder course must happen after laying down the aggregates at any position over the road alignment. In the following example, the rolling activity is finished earlier than laying the aggregates at the end (i.e. there is a clash), which is wrong. Identifying such errors in a Gantt chart that includes thousands of activities is challenging (ref. Figure 1 – Gantt Chart Clash ID). However, you can instantly identify such issues by looking at the Time-Location charts (ref. Figure 2 – Time-Location Chart Clash ID).


Project Delay
In the previous road construction project example, the gap between the finish of Surface Course Rolling and Bitumen Prime Coat activities would lead to the project’s delay because both activities are on the critical path.
Time-Location charts facilitate identifying and improving such problems (ref. Figure 3 – Schedule Improvement).

Summary
Time-Location charts are great tools to identify a linear project’s schedule shortfalls that cannot be readily identified through Gantt charts.
Several methods may be proposed to resolve those problems – that are out of the scope of this article.
PM ERA Inc. has the right tools and expertise to assist you with your needs and empower your organization in linear scheduling techniques.
For more information, please visit our website at www.pmera.com , or give us a call to talk to one of our consultants.